
Navigating Replacement Risk In Your Carbon Removal Portfolio
This next wave of buyers have commitments to meet, claims to make and are generally more risk averse than early buyers. As the market moves towards claims driven use cases, the strategic focus changes from catalytic purchases to a much harder question: How do I build a portfolio that actually aligns with my use case and risk tolerance?
At CUR8, we know that this question is critical in unlocking this next wave of demand. We also know that it takes more than simple labels or static certifications for buyers to feel secure in their decisions. Instead, they need tools that ground their specific risk appetite in the hard realities of the market. Carbon removal is complex and it has risks, but both can be predicted and priced.
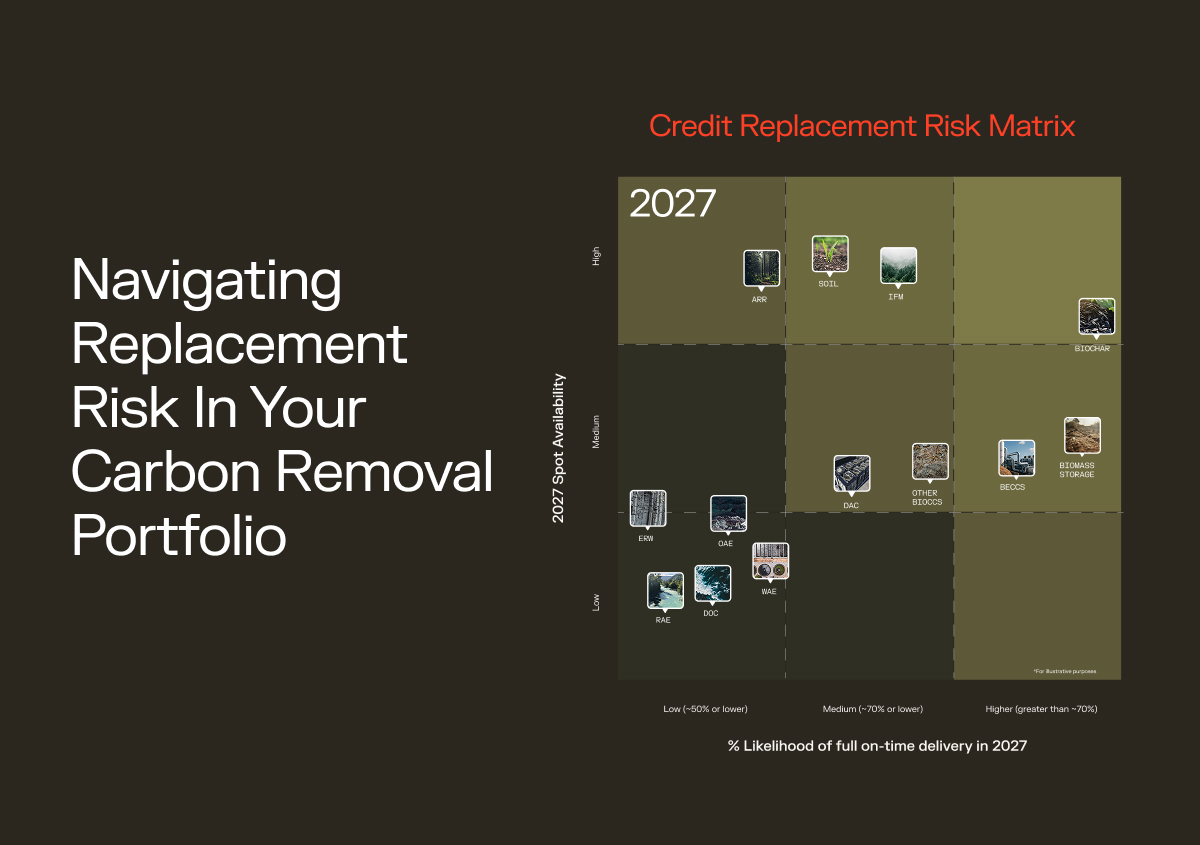
While there are many ways to slice the data - price, durability, geography - one unique element of our models that we use to help our customers such as British Airways, Coca Cola HBC, Arup and more to navigate risk is - the Replacement Risk Matrix. This maps potential spend on carbon removal against two critical axes: Likelihood of Delivery and Spot Credit Availability. Together these dimensions form a replacement risk matrix.
The Replacement Risk Matrix: Delivery vs. Availability
When constructing a portfolio - especially where a buyer is aiming to make retirements in specific years to meet a commitment, (e.g., "Net Zero Operational Emissions by 2030”), it is important to understand how likely it is your credits will deliver on time, and if they don’t - how much spot availability will there be for equivalent credits at the same price point.
- Likelihood of Delivery: What is the probability that a tonne purchased today (ex-ante) will actually be sequestered, verified and delivered in the targeted vintage year?
- Spot Availability: How much "off-the-shelf" inventory will there be available to substitute the lost credit and make your planned retirement?
By plotting methods on this matrix, buyers can visualise where their portfolio sits on the spectrum of risk.
Indicative Analysis: The Evolving Replacement Risk Matrix
Note: The following categorisations are indicative for the purpose of this discussion to illustrate the framework. It is not a definitive rating of % delivery likelihood for all projects within these method categories, which vary significantly by supplier and region.
This matrix is not a static picture, methods will evolve in both their likelihood of delivery and their spot availability over time. To demonstrate how this framework guides decision-making, we can look at how two different methods might sit on this matrix for the 2027 vintage.
High Delivery Likelihood / Higher Spot Availability
In the top-right quadrant, we often find methods where the production technology is relatively mature and the supply chain is established or evolving quickly.
In 2027, for example, Biochar sits towards the top right of this matrix, with the production mechanics well-understood, mature project registration, and two to three years of operational history for many projects.
Ultimately, for methods like biochar - operational maturity and track record of delivery generally leads to a higher likelihood of successful credit delivery for a 2027 vintage. Crucially, because the biochar market is scaling rapidly, there is also emerging spot availability relative to more nascent methods. If a specific project faces a delay, the market is liquid enough that a buyer could potentially find a substitute to meet their volume target.
Delivery risks will remain low for biochar out to 2030 and 2035 - although spot availability may actually decrease from 2027 to 2030, as buyers with 2030 targets absorb the supply of credits.
Lower Delivery / Lower Availability
Conversely, other methods may currently sit in the bottom-left quadrant for the 2027 timeframe.
Using Enhanced Rock Weathering (ERW) as an example for this discussion: the method has high potential but is relatively nascent, with very few credits issued to date. As project developers learn more about the kinetics of weathering and the complexity of field measurements, projects may experience delays and under delivery for earlier vintages.
Given these challenges, spot availability for high-quality credits in this specific method is also likely to be constrained for earlier vintages; it is less likely that you would be able to replace these credits, in a method-for-method way, if your ERW project faces delays or under delivery.
As the science, project operational history, and MRV technology matures, we expect that the likelihood of delivery will increase, along with spot availability out to 2030 and 2035.
Mapping Strategy to Risk Appetite
It is important to state this matrix is clearly not an exhaustive analysis of the relative qualities and risks of CDR methods. The goal of this framework is to help buyers align their purchases with their use case.
For example, if a corporation requires a specific volume of delivery in 2027 to back a public claim (e.g., "Carbon Neutral Employee Travel by 2027"), they should ensure their portfolio is well-indexed towards the "High Delivery / High Availability" quadrant. In this scenario, the buyer is paying for certainty and the ability to mitigate failure with spot volume.
However, if a buyer is more interested in supporting market innovation and methods to maturity, it may make strategic sense to support methods in the bottom-left hand corner. By engaging here, buyers play a role in moving these methods further along both axes - helping them mature technically and building market depth.
The trade-off may be higher delivery risk in the short term, but the upside could be significant if the buyer is looking to establish favourable commercial terms with promising but early projects, to support longer term credit requirements (e.g. Net Zero 2050).
Empowering Buyers to Take Control of Their Portfolio Risk
This matrix is just one example of how to view the market, but it highlights a simple but often underappreciated reality in the CDR market: Project risk is not static.
A project that sits in a less favourable quadrant today may become a leading project in the market over the medium to longer term. To navigate this, buyers need more than static due diligence reports. They need dynamic, independent insights that track project progress and method level breakthroughs over time.
Both the market and the underlying science are evolving rapidly. With buyers now signing large multi-year offtake agreements (reaching into the 10s of millions of dollars) to secure access to high-quality supply at preferential price points, in order to meet long term business and net zero requirements. One-off risk evaluations just won’t cut it.
But with the right approaches and ongoing insights, buyers can stop guessing and start building and managing portfolios that truly serve their climate and commercial goals.
Get started today:

February 19, 2026
.png)

